While the announcement was by no means earth shattering and not the only source highlighting an impending change, it was a key reminder that, at some point, the metal hungry country would have to transition from an investment led economy to a more consumer led one. It also showed that those in charge were starting to think more seriously about how to do this.
“China’s leaders have recognised that the country’s growth model, which has been so successful for the past 30 years, will need to be changed to accommodate new challenges,” said World Bank president Robert Zoellick at the time.
“It’s very important this is a joint report, so this isn’t just an outsider coming in and giving a view, but it’s been something that’s been worked over extensively by Chinese and World Bank counterparts over a year-and-a-half,” he added.
Fast forward four years and the fall in commodity prices shows not only a lack of significant Chinese growth in metals consumption and the slowest GDP growth rate since 2009, but also how dependent on a fast-growing China metals prices were in the first place.
In Rio Tinto’s annual report, chairman Jan du Plessis pointed out that for some of the commodities the company produces, prices were at levels not seen since 2005, or only briefly at the depth of the global financial crisis.
A massive rout towards the end of 2015 into early 2016 saw prices really take a dive, but since then there has been signs of recovery … or at least a floor, perhaps, as metal prices find a new balance in this uncertain environment.
There have also been some signs of improvement in China. Retail sales growth increased to 10.5% in March, up 10.2% month-on-month. Industrial output rose 6.8% in March. There has also been a massive expansion in credit. Some say that it may not be sustainable.
“The credit expansion has and will continue to lead to further fixed asset investment which will sustain the rally in commodity prices longer than we had expected,” said London-based Liberum in a note.
“However, we continue to believe that demand this year has been front-end loaded and that the government will try to stick to their credit targets, as current levels are not sustainable, [this] will lead to further misallocation of capital and an eventual credit crisis.”
Let’s hope BHP Billiton chief executive Andrew Mackenzie was right when he recently told The Australian newspaper: “If you look at the basket of commodities that we deal with, the numbers are self-evident: the fall has stopped.”
Mackenzie was backed up by Citigroup this week when analysts said: “There is growing evidence that virtually all commodities have stared at a price bottom and are groping for a return to normal.”
Revenue bottom?
If Mackenzie and Citigroup are right, that could mean this year’s Mining Journal Top 100 list covering 2015 may represent the lowest mining revenue total, down 20% on last year, for this particular cycle and a steady improvement should be evident in future editions.
Although it is touch and go, this year may yet be the low point of revenues in the sector given the bottom for most prices was reached in January and we still have more than eight months of the year ahead of us.
To give you an idea of how close to the bottom we still are, gold has averaged US$1,190 per ounce in the year so far, just $30 above its 2015 average, while the 62% iron ore price averaged $48.30/tonne in the three months to end March, compared to $50/t in the whole of 2015.
The trend is definitely upward, however, with both of those commodities trading appreciably higher than those averages as Mining Journal went to press.
Unfortunately, this is not consistent all the way through the commodity basket. For example copper, a big contributor to global mining revenues, is averaging about $4,630/t so far this year, almost $800/t or 15% below the 2016 average.
The price currently sits around the $4,800/t mark and so we may see the gap narrow by year-end.
This massive loss of revenue feeds through to market valuations because no matter how good the cost improvements or increases in output have been, falling commodity prices have taken a big bite out of profit margins, in some cases down to the bone.
At February’s Mining Indaba in Cape Town, Anglo American CEO Mark Cutifani birds-eyed the down cycle’s timeline when he said: “Global mining stocks have lost $1.4 trillion of market value since 2011, more than the combined value of Apple, ExxonMobil and Google.”
This year’s price gains in many commodities have, however, been phenomenal and have helped company market caps regain much ground on those basement-level values.
Taking the top five on the Top 100 list as a snapshot shows the combined market capitalisation of this group of diversified majors has grown by 20%, or a massive $40 billion, since January. Together at $193 billion they now made up almost 26% of the total list’s $778 billion market value in 2015.
There are those that haven’t experienced much of a rebound since the start of 2016, particularly the US coal miners, which have had billions wiped off their equity values as they continue to drown in debt.
In the second half of January, coincidently at around the same time many commodities hit a recent floor in prices, ratings agency Moody’s put 55 mining companies under review for downgrade.
“This is not a normal cyclical downturn, but rather, one we perceive to be unprecedented,” said the agency, adding: “Stress on companies in the metals and mining industry could surpass what we saw during the 2008/2009 period.
“Prices peaked in 2012 for most base metals, with a subsequent gradual price decline in 2013 and 2014 that allowed companies to adjust mining plans and exploration expenses. However, price declines accelerated sharply in mid and late-2015 and that has continued in the first few weeks of 2016.”
Ernst & Young says a total of 46 mining and metal companies had already entered bankruptcy proceedings in 2015 with the US coal sector contributing 20 casualties to the list.
The peak of this moment in that sub-sector’s history was reached just days ago, as industry giant Peabody filed for Chapter 11 bankruptcy protection as years of falling prices and its $6 billion in borrowings finally broke the dam.
“The unprecedented decline in the US coal sector has been driven by several structural factors, including the switch to natural gas-fired power stations owing to both the sustained glut in low-cost natural gas and environmental and pollution regulation.
“Miners that overinvested in the high-sulphur coal of the Appalachian region are the worst affected,” said Ernst & Young.
Mining Journal’s analysis
The biggest change on this year’s Top 100 (measured by 2015 US dollar mining revenue), although tipped in last year’s tabling, was Rio Tinto taking top spot, following BHP Billiton’s unbundling of a chunk of its businesses into a new entity called South32.
South 32 itself has debuted at number 27, while BHP has only dropped two spots to number three.
Besides that, there was not much change in the top ranks as most diversified majors were all operating under the same dark cloud.
Delving into the rest of the 2015 list, one gets an immediate sense of those most affected by the downturn.
For instance, eight out of the top-10 fallers that managed to retain a spot in the Top 100 were primary iron ore miners with operations located all over the world. This is hardly surprising considering the year’s average 62% Fe price almost halved from $96/t a year earlier.
At the bottom of the list, while the revenue cut-off for making the top 100 did remain at slightly more than $1 billion in 2014, last year saw 100th place Eldorado clocking in at $863 million.
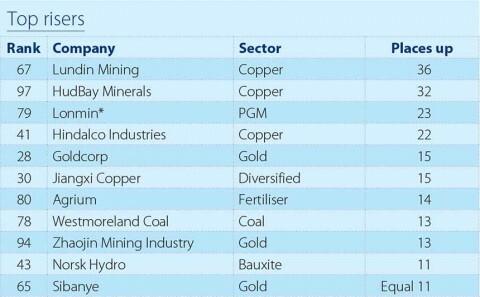
On the other side of that coin, the companies that gained the most places, or managed to make the list for the first time, were ones that added production in one way or another, countering the dramatic falls in commodity supply.
HudBay managed to join at number 97, having been more than 30 places lower last year on the expanded watch list, as the company successfully ramped-up new mines in 2015. Revenue grew 75% from $507 million to $886 million as it threw out 104,000t more copper than a year earlier, with gains in its other commodities as well.
Another base metals producer, Lundin Mining, also joined the Top 100, at position 68, having been just outside the rankings a year earlier.
The company has done well to use the downturn as an opportunity to buy assets off the major mining companies, having spent more than $2 billion in under three years.
The company reported an equally impressive 78% gain in revenue to $1.7 billion, largely due to the inclusion of full year operating results from the Candelaria and Eagle mines.
Production started at the Michigan-based Eagle mine in the December quarter of 2014 after Lundin had acquired the development project for $325 million from Rio Tinto in June 2013. Candelaria in Chile was bought from Freeport-McMoRan in late 2014 for $1.8 billion.
The story for the third best gainer, Lonmin, is more to do with a very poor 2014 than major growth in 2015. The company also reports annual results to the end of September, and this does affect comparisons.
A return to normal following major strike action in South Africa during the previous year meant the company returned into the Top 100 in 79th place, having just dropped out of the running the year before.
Gold companies, which increased production and took less of a knock on the commodity they produce (gold averaged 8% less in 2015), were also prominent in the list of upward movers.
This was evidenced by the fact that gold revenue within the top hundred was one of only two commodity classes to show gains this year as four of the eight new entries were gold counters.
Again, there was a clear flavour of coal and iron among the companies that fell out of the top 100 in 2015, with Nyrstar and its troubled zinc mining business the odd one out.
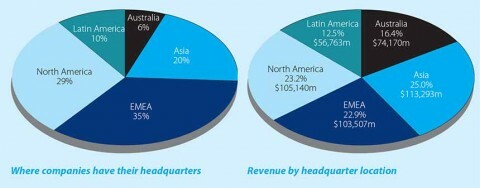
Revenue by category
Overall, revenues were down 20% at $453 billion compared with $568 billion a year earlier.
Besides gold revenues being the clear winner in this year’s list, Lonmin’s increase in revenue helped PGM revenues grow by almost 12%.
This swing meant those precious metals took more share of the overall total revenue with a combined 16%.
This was at the expense of the diversified companies that still made up a dominant 36% of revenues compared with 41% in 2014.
The biggest fallers were unsurprisingly producers of steel making materials and thermal coal.
Regionally, most companies were headquartered in Europe, Middle East and Africa at 35.
Although there wasn’t much to separate the dollar mining revenue’s reported from the groups of companies in EMEA with Asia and North America.
As mentioned earlier, the market capitalisations in general have improved since the end of 2015 but in total are 18% below where they were last year when the list was compiled, which itself was a year where valuations fell 13%.
For comprehensive global mining investment and business coverage, go towww.mining-journal.com